
 EN
EN
 ar
ar bg
bg hr
hr cs
cs da
da nl
nl fi
fi fr
fr de
de el
el hi
hi it
it ko
ko no
no pl
pl pt
pt ro
ro ru
ru es
es sv
sv tl
tl iw
iw id
id lv
lv lt
lt sr
sr sk
sk sl
sl uk
uk vi
vi et
et hu
hu th
th tr
tr fa
fa ms
ms hy
hy ka
ka ur
ur bn
bn mn
mn ta
ta kk
kk uz
uz ku
ku
Integrated Monitoring Station
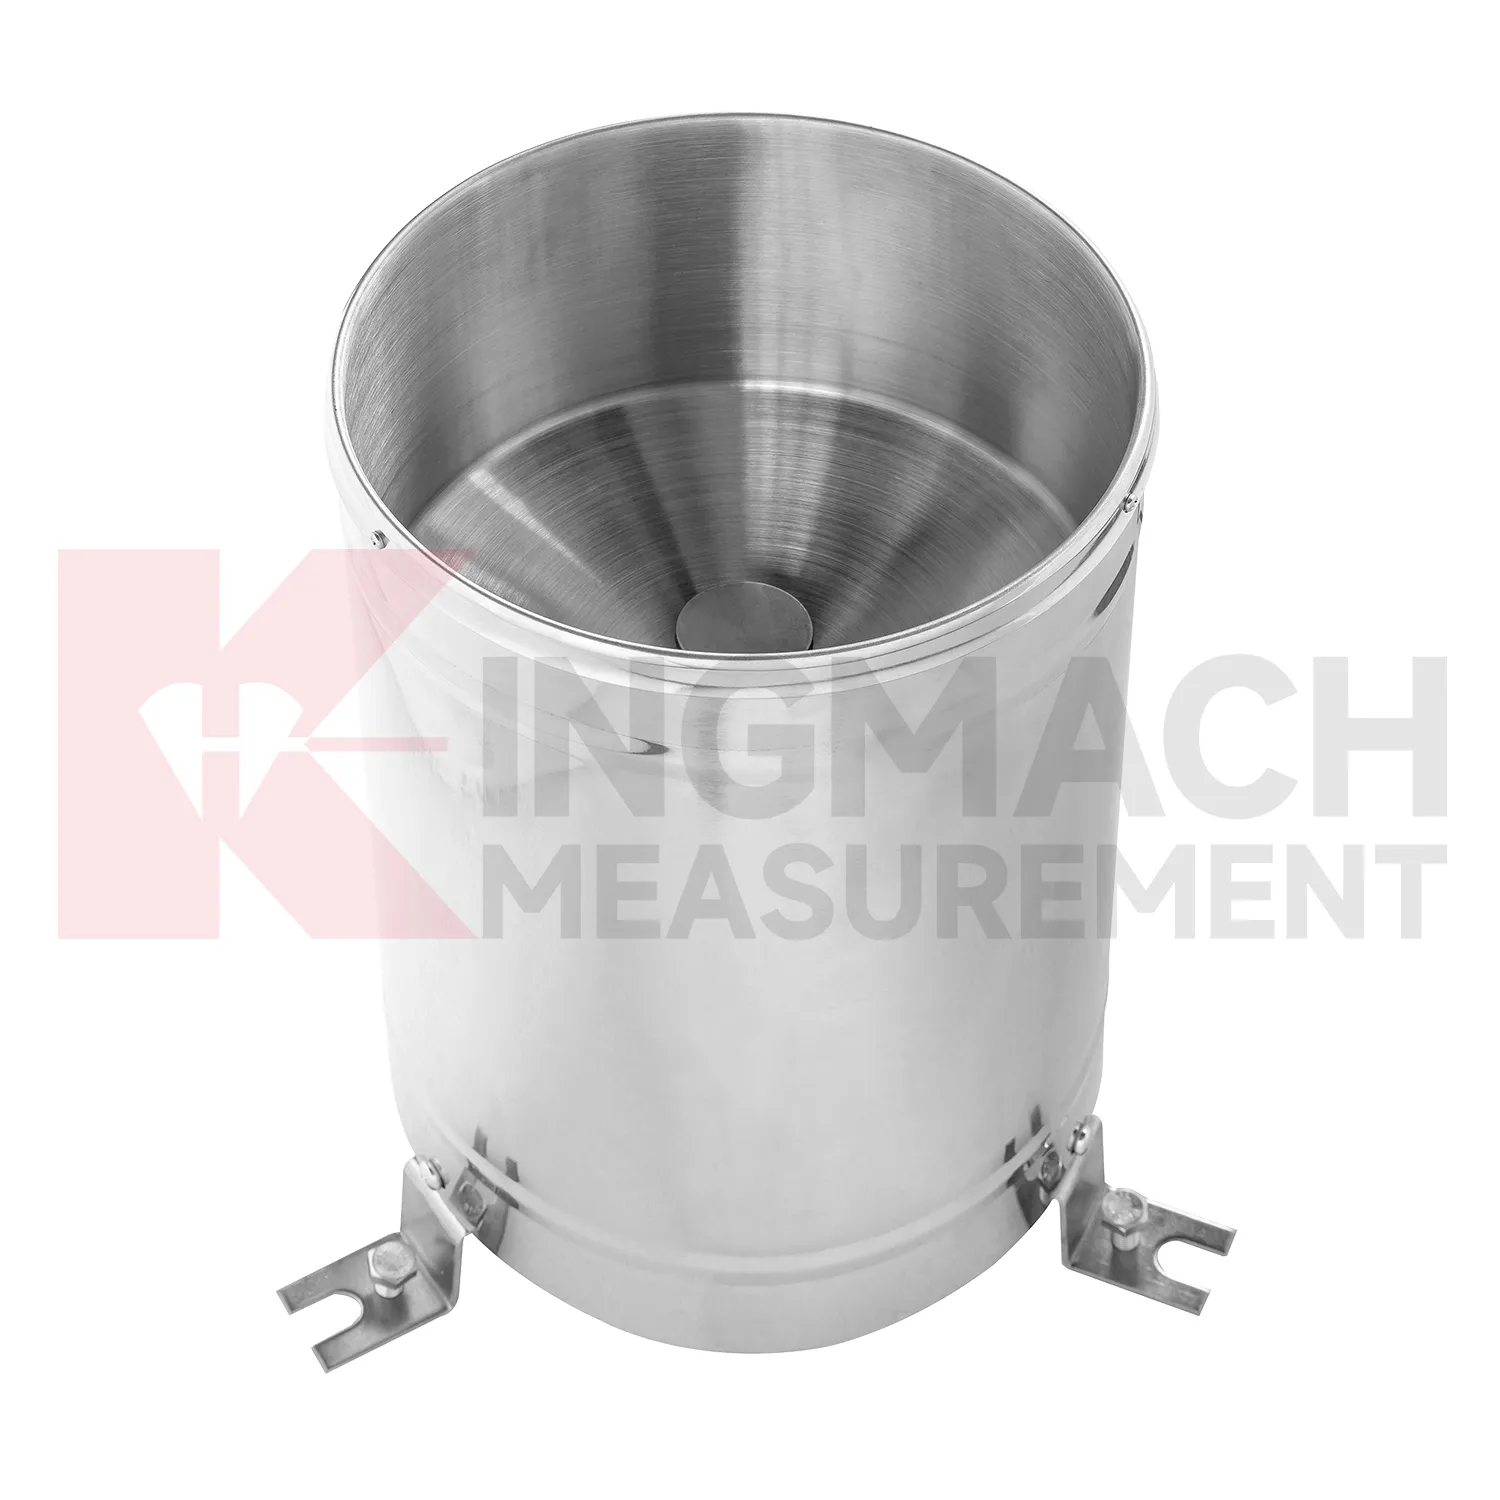
Data acquisition for Kingmach Integrated Monitoring Station should be organized around units, time, and relationships. Environmental channels may report rainfall, wind, pressure, temperature, humidity, or soil wetness, and each needs a clear unit and location. A mixed station becomes confusing if channel names are vague or if the data logger does not preserve the relation between environmental points and structural points. The project file should define which environmental channel supports which engineering review. Rainfall may connect to slope movement. Wind may connect to vibration. Temperature may connect to strain. Humidity may connect to cabinet maintenance. A simple channel map can save a great deal of time during an alarm. Good acquisition practice makes environmental data reliable enough to use when the site is under stress.
Long-term value comes from consistency. A channel that keeps the same location, unit, maintenance history, and linked asset record can support seasonal comparison, post-storm review, and handover between construction and operation teams.
Maintenance teams should record cleaning, access difficulty, enclosure condition, cable repair, vegetation growth, nearby equipment changes, and the first normal reading after work. Those notes protect the meaning of the curve when old data is reviewed months later.
The environmental point should be part of a named monitoring question. It may explain wetting, drying, wind exposure, thermal movement, cabinet stress, or pressure variation, but that purpose needs to be visible in drawings and reports.
Application of Integrated Monitoring Station
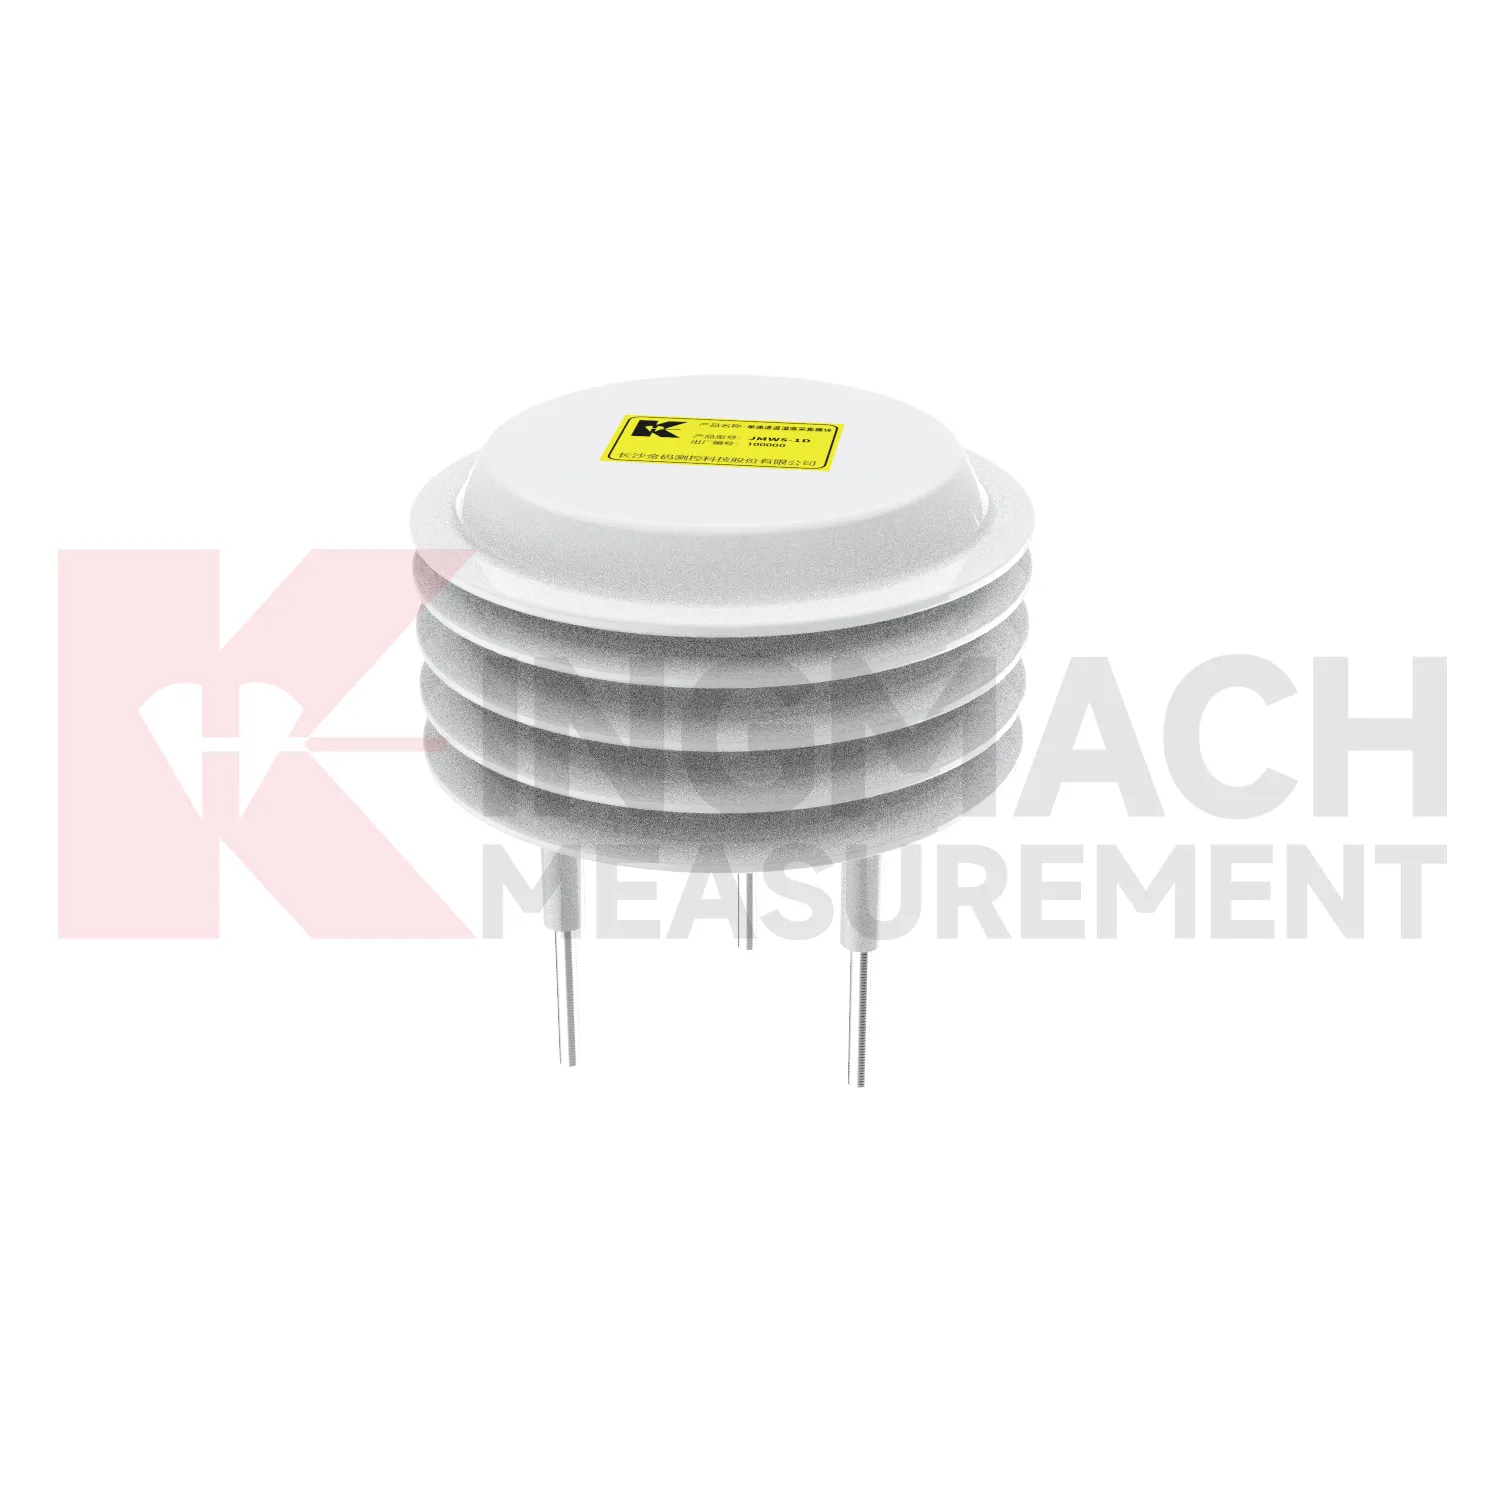
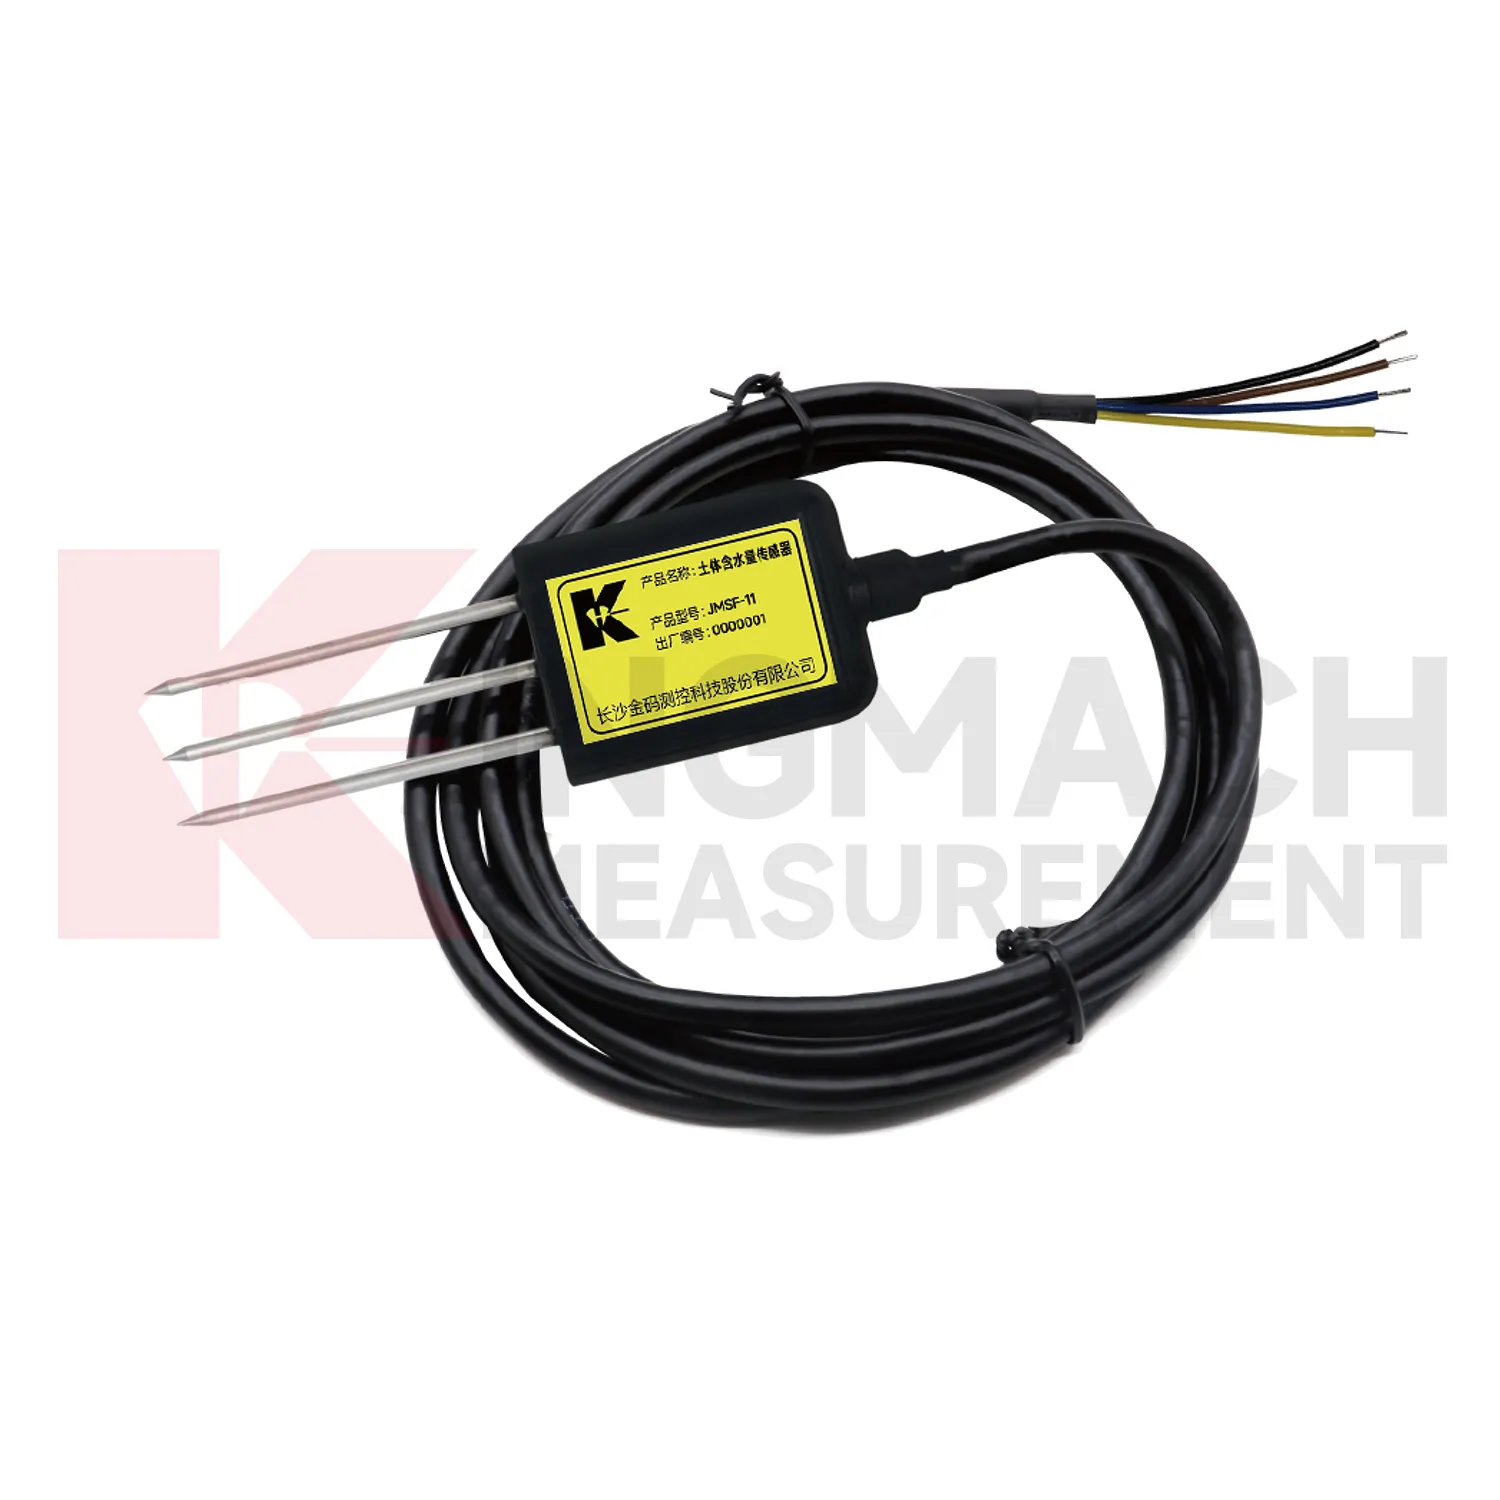
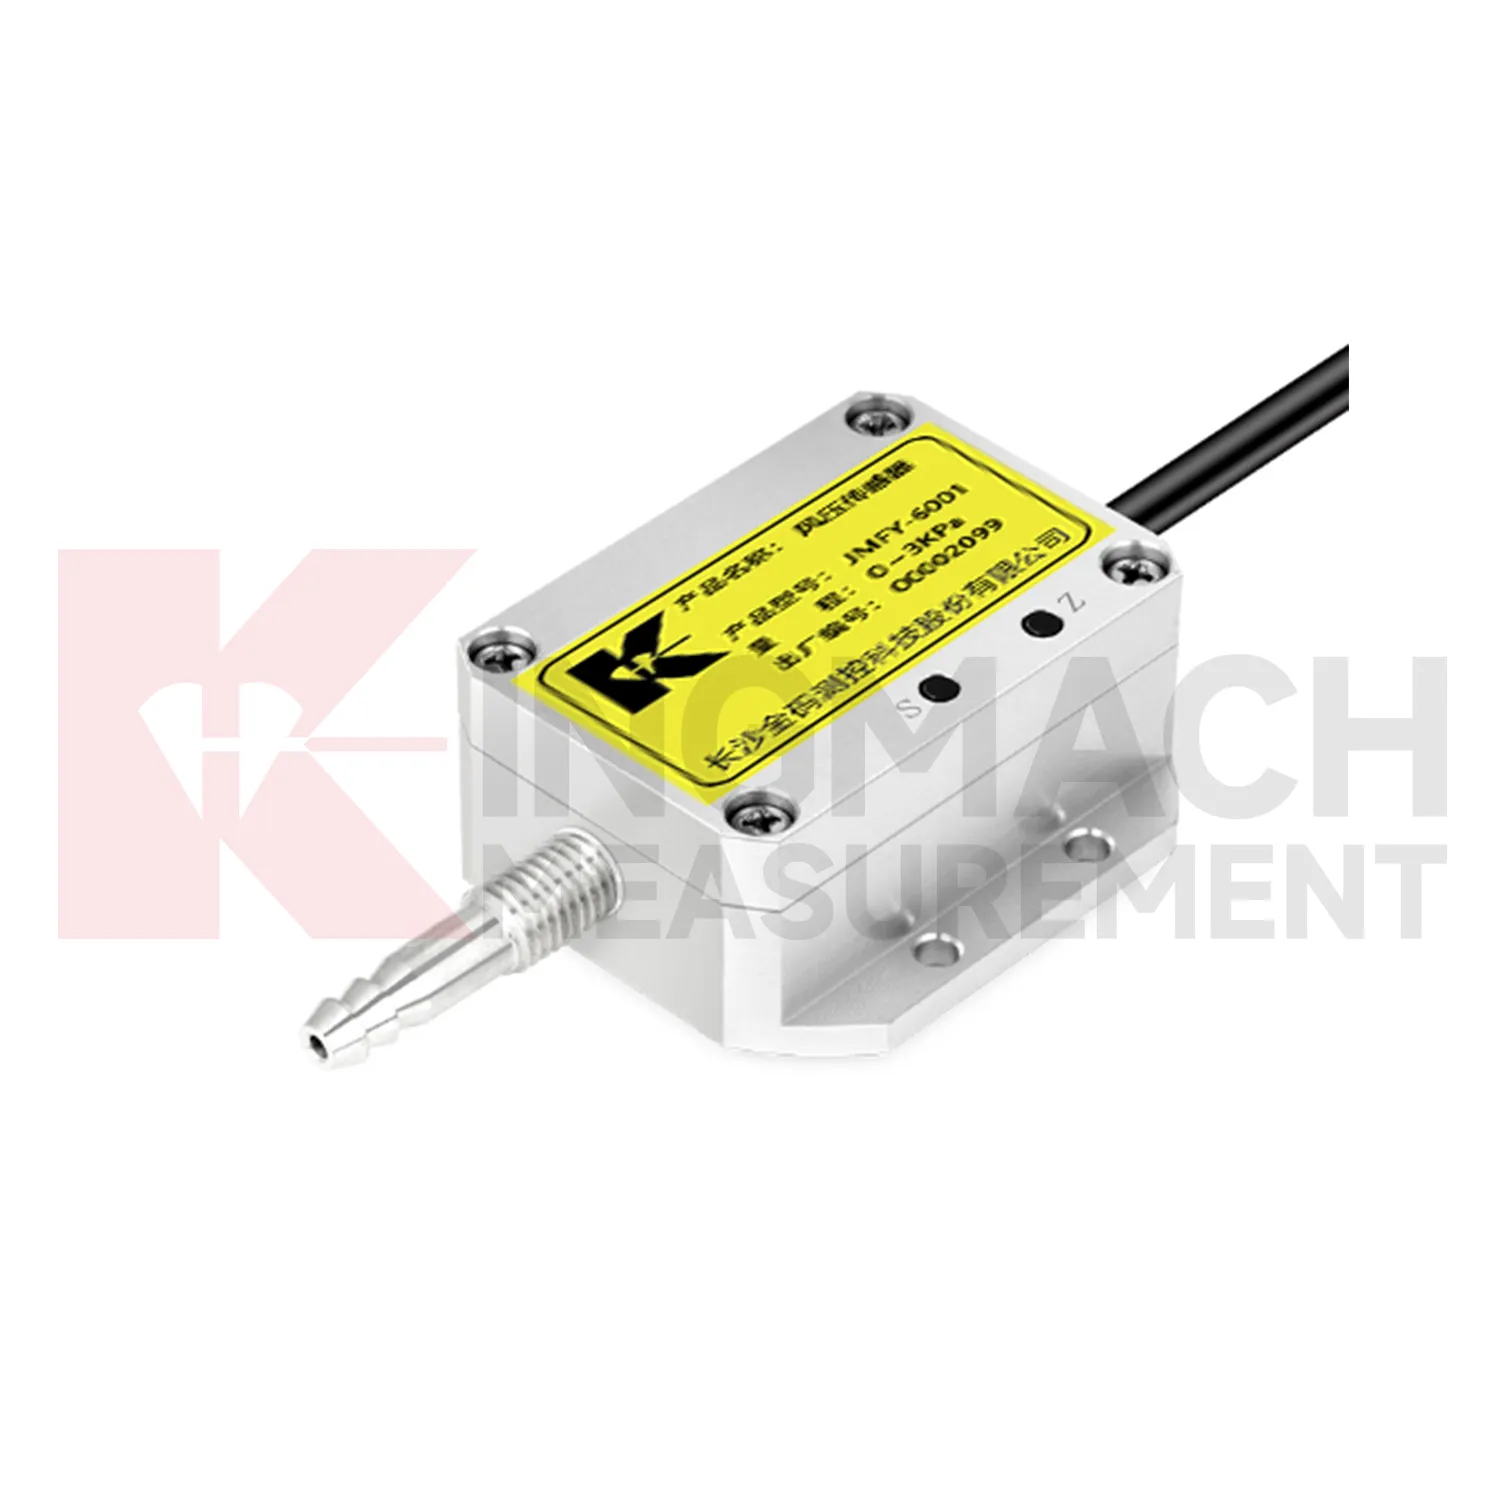
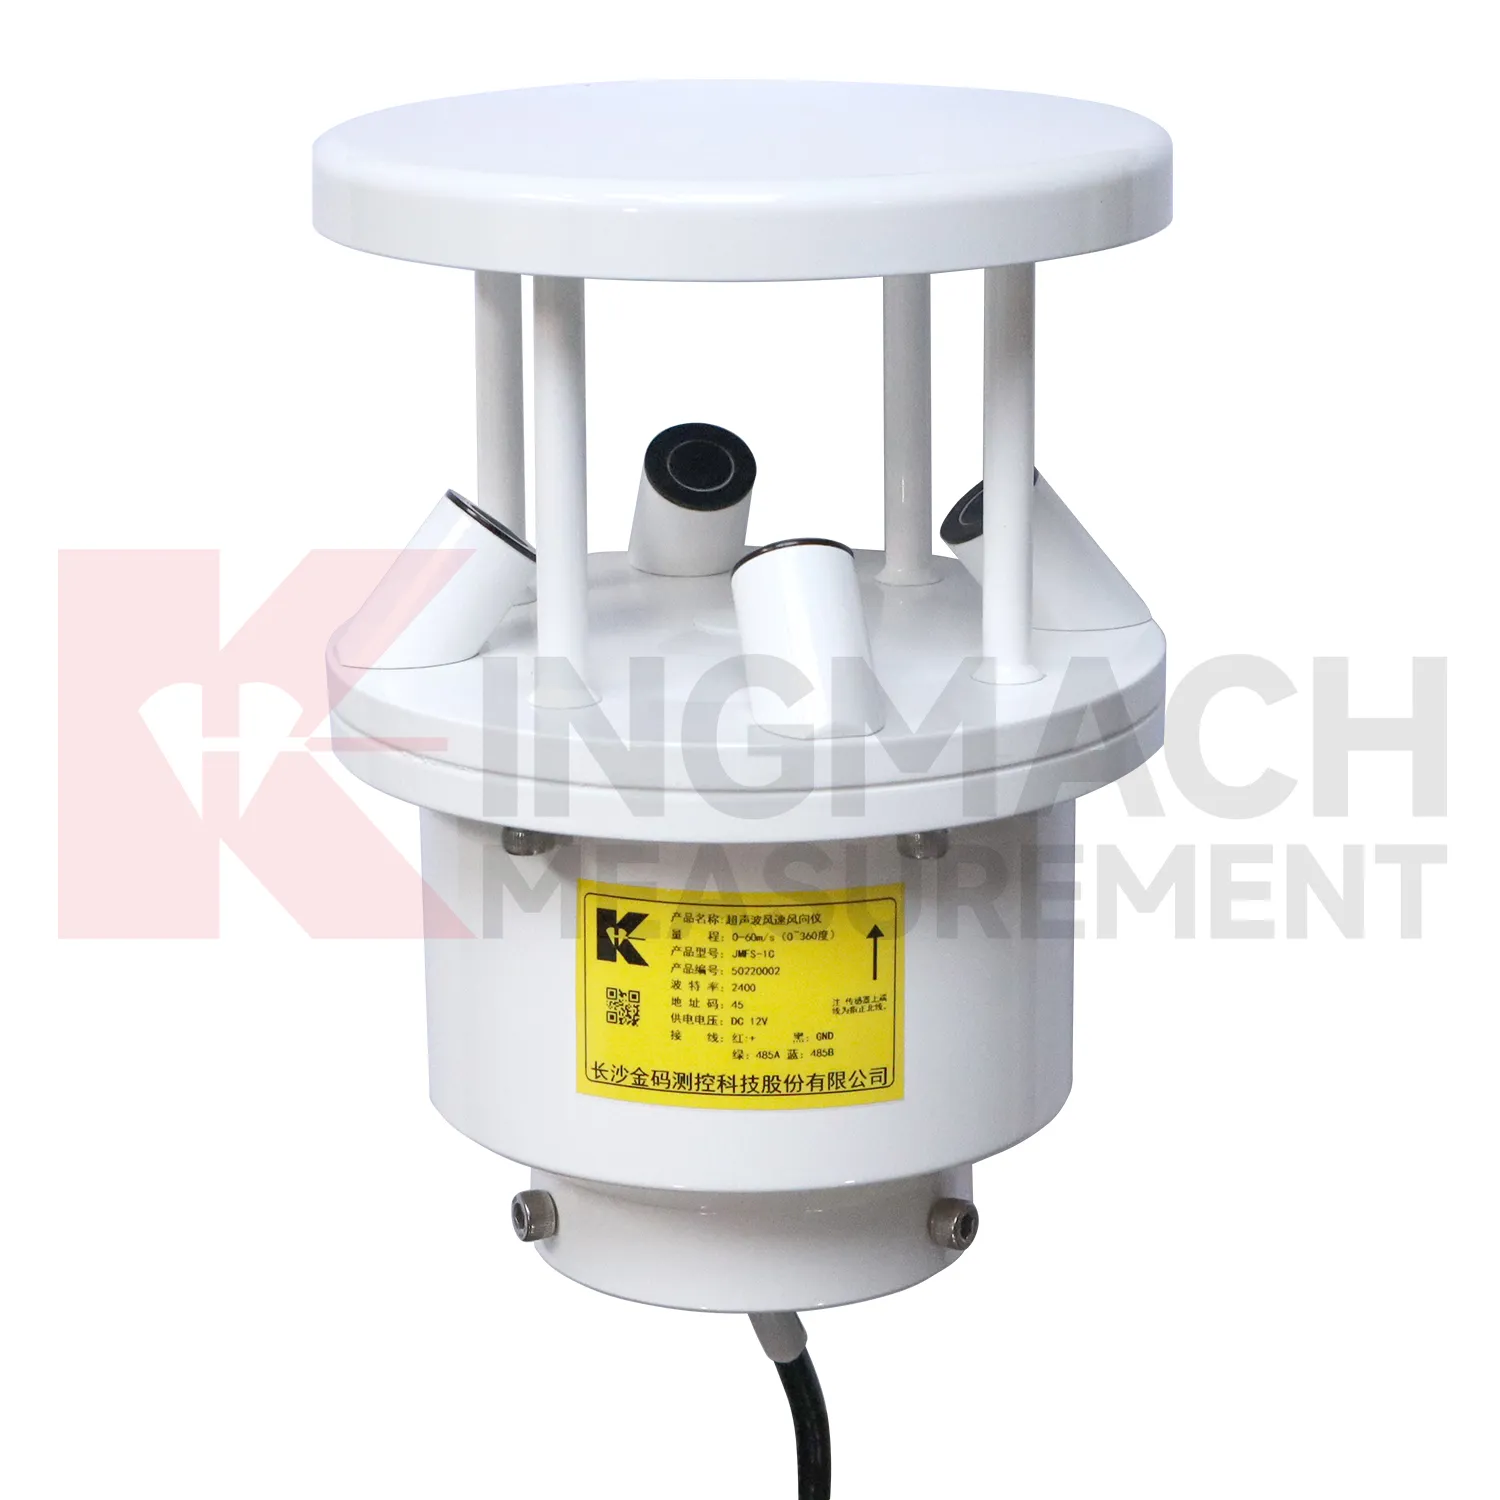
Slope monitoring uses Kingmach Integrated Monitoring Station to connect weather, soil conditions, and ground movement. The field problem is rarely just one number. Rain may fall at the surface, water may enter the soil slowly, and movement may appear hours or days later. A useful slope station should therefore combine rainfall history, buried wetness, ground displacement, tilt, crack observation, and inspection notes in one review timeline. Environmental points need careful placement: rainfall should be measured in an open area, soil wetness should be measured at meaningful depths, and cables should be protected from surface work or erosion. When movement accelerates after a wetting pattern, the monitoring team can inspect the affected area with stronger evidence. When movement does not match rainfall or soil wetness, other causes such as excavation, loading, drainage change, or retaining-structure movement may need attention.
During abnormal events, the first question is not only whether the value crossed a limit. The reviewer should ask what changed around the site, whether the related structure reacted, and whether a field inspection confirmed the same pattern.
Long-term value comes from consistency. A channel that keeps the same location, unit, maintenance history, and linked asset record can support seasonal comparison, post-storm review, and handover between construction and operation teams.
Maintenance teams should record cleaning, access difficulty, enclosure condition, cable repair, vegetation growth, nearby equipment changes, and the first normal reading after work. Those notes protect the meaning of the curve when old data is reviewed months later.
The future of Integrated Monitoring Station
The future of Kingmach Integrated Monitoring Station will focus on linking environmental triggers directly to structural behavior. Owners do not only need to know that rain fell, wind rose, or humidity changed. They need to know whether those conditions explain movement, strain, vibration, seepage, or equipment faults. Future monitoring reports should place condition curves and structural curves on the same timeline with inspection notes. That will make it easier to distinguish weather-driven behavior from progressive deterioration. The practical improvement is not more scattered data; it is clearer relationships. When environmental records are connected to the assets they affect, engineers can review alarms faster and plan field checks with better evidence.
This direction will also change how warning levels are written. A slope warning may depend on rainfall history and wetting trend, while a bridge warning may depend on wind period and structural response. Future systems should allow these links to be visible instead of forcing every channel into one isolated threshold.
For owners, the benefit is a shorter path from alarm to action. A reviewer can see the condition that changed, the asset that reacted, the inspection that followed, and whether the response returned to normal. That is more useful than separate charts that require manual reconstruction.
Care & Maintenance of Integrated Monitoring Station
Data review is part of maintaining Kingmach Integrated Monitoring Station. Look for impossible values, flatlines, repeated spikes, missing intervals, unit mistakes, and disagreement between related channels. Rainfall should have a plausible relation to wetting; wind pressure should be reviewed with wind exposure; humidity changes should match room or cabinet conditions. If a structural alarm occurs, environmental records should be checked before the team concludes that the structure changed. A good review compares time stamps, site events, maintenance logs, and nearby instruments. This habit keeps environmental records believable and turns them into a reliable part of engineering review.
Review work should also separate data-quality questions from engineering questions. A strange value may come from a blocked rain point, sheltered wind path, wet connector, moved cabinet, or changed unit setting. The reviewer should clear those possibilities before treating the record as a site condition.
Monthly checks can include a short data-quality note that lists missing intervals, unusual values, repaired points, and channels needing field inspection. This makes the environmental network easier to manage and keeps abnormal-event reports from being built on weak records.
Kingmach Integrated Monitoring Station
The data chain behind Kingmach Integrated Monitoring Station should be as clear as the sensors themselves. Environmental channels may use different signal types, units, update intervals, and power needs. If the channel names are weak, a report may confuse rainfall with another station, wind direction with wind speed, or room humidity with cabinet humidity. Each point should have a unit, location, data path, inspection interval, and linked structural record. This prevents environmental data from being collected but ignored. During an alarm, the team should be able to open one timeline and see the condition change, the structural response, and the maintenance note. That is where environmental monitoring becomes practical.
During abnormal events, the first question is not only whether the value crossed a limit. The reviewer should ask what changed around the site, whether the related structure reacted, and whether a field inspection confirmed the same pattern.
Long-term value comes from consistency. A channel that keeps the same location, unit, maintenance history, and linked asset record can support seasonal comparison, post-storm review, and handover between construction and operation teams.
FAQ
Q: How does rainfall data support slope review?
A: Rainfall gives the timing and intensity background for movement, seepage, wetting, and field inspections after storms.
Q: Why measure soil wetness as well as rainfall?
A: Rainfall stays at the surface record, while buried wetness shows whether water reached the soil depth that may influence movement.
Q: How does wind data support bridge or tower monitoring?
A: Wind direction and exposure can explain vibration, deflection, access difficulty, and weather-driven structural response.
Q: Why monitor humidity underground?
A: Humidity can affect cabinets, connectors, corrosion, sensor stability, and operating conditions in tunnels, subways, mines, and equipment spaces.
Q: How does temperature help interpretation?
A: Temperature helps reviewers separate thermal behavior from structural change in strain, displacement, cabinet condition, or material response.
Long-term value comes from consistency. A channel that keeps the same location, unit, maintenance history, and linked asset record can support seasonal comparison, post-storm review, and handover between construction and operation teams.
Reviews
Michael Anderson
The strain gauges and load cells are extremely accurate and stable. They performed very well in our bridge monitoring project. Highly recommended!
Joshua Clark
We ordered a full monitoring solution including sensors and data loggers. Everything works seamlessly together. Great supplier!
Latest Inquiries
To protect the privacy of our buyers, only public service email domains like Gmail, Yahoo, and MSN will be displayed. Additionally, only a limited portion of the inquiry content will be shown.
Emma***@gmail.comCanada
Dear Sir/Madam, we are interested in displacement transducers and settlement sensors for a geotechni...
Mia***@gmail.comNetherlands
Dear team, we are interested in your readouts & data loggers compatible with multiple sensors. Do yo...
Related product categories
- tipping bucket rain gauge resolution 0.1 mm standard
- rain gauge tipping bucket
- tipping bucket rain gauge sensor
- tipping bucket type rain gauge
- tipping rain bucket gauge
- tipping bucket rain gauge 0.2 mm per tip standard
- tipping bucket rain gauge 0.2 mm resolution standard
- tipping bucket rain gauge data logger
- tipping bucket rain gauge resolution 0.1 mm typical
- tipping bucket rain gauge resolution 0.2 mm typical
- tipping bucket rain gauge typical resolution 0.2 mm standard
- typical tipping bucket rain gauge resolution 0.2 mm standard